Remote monitoring for all components of solar PV system
The Challenge
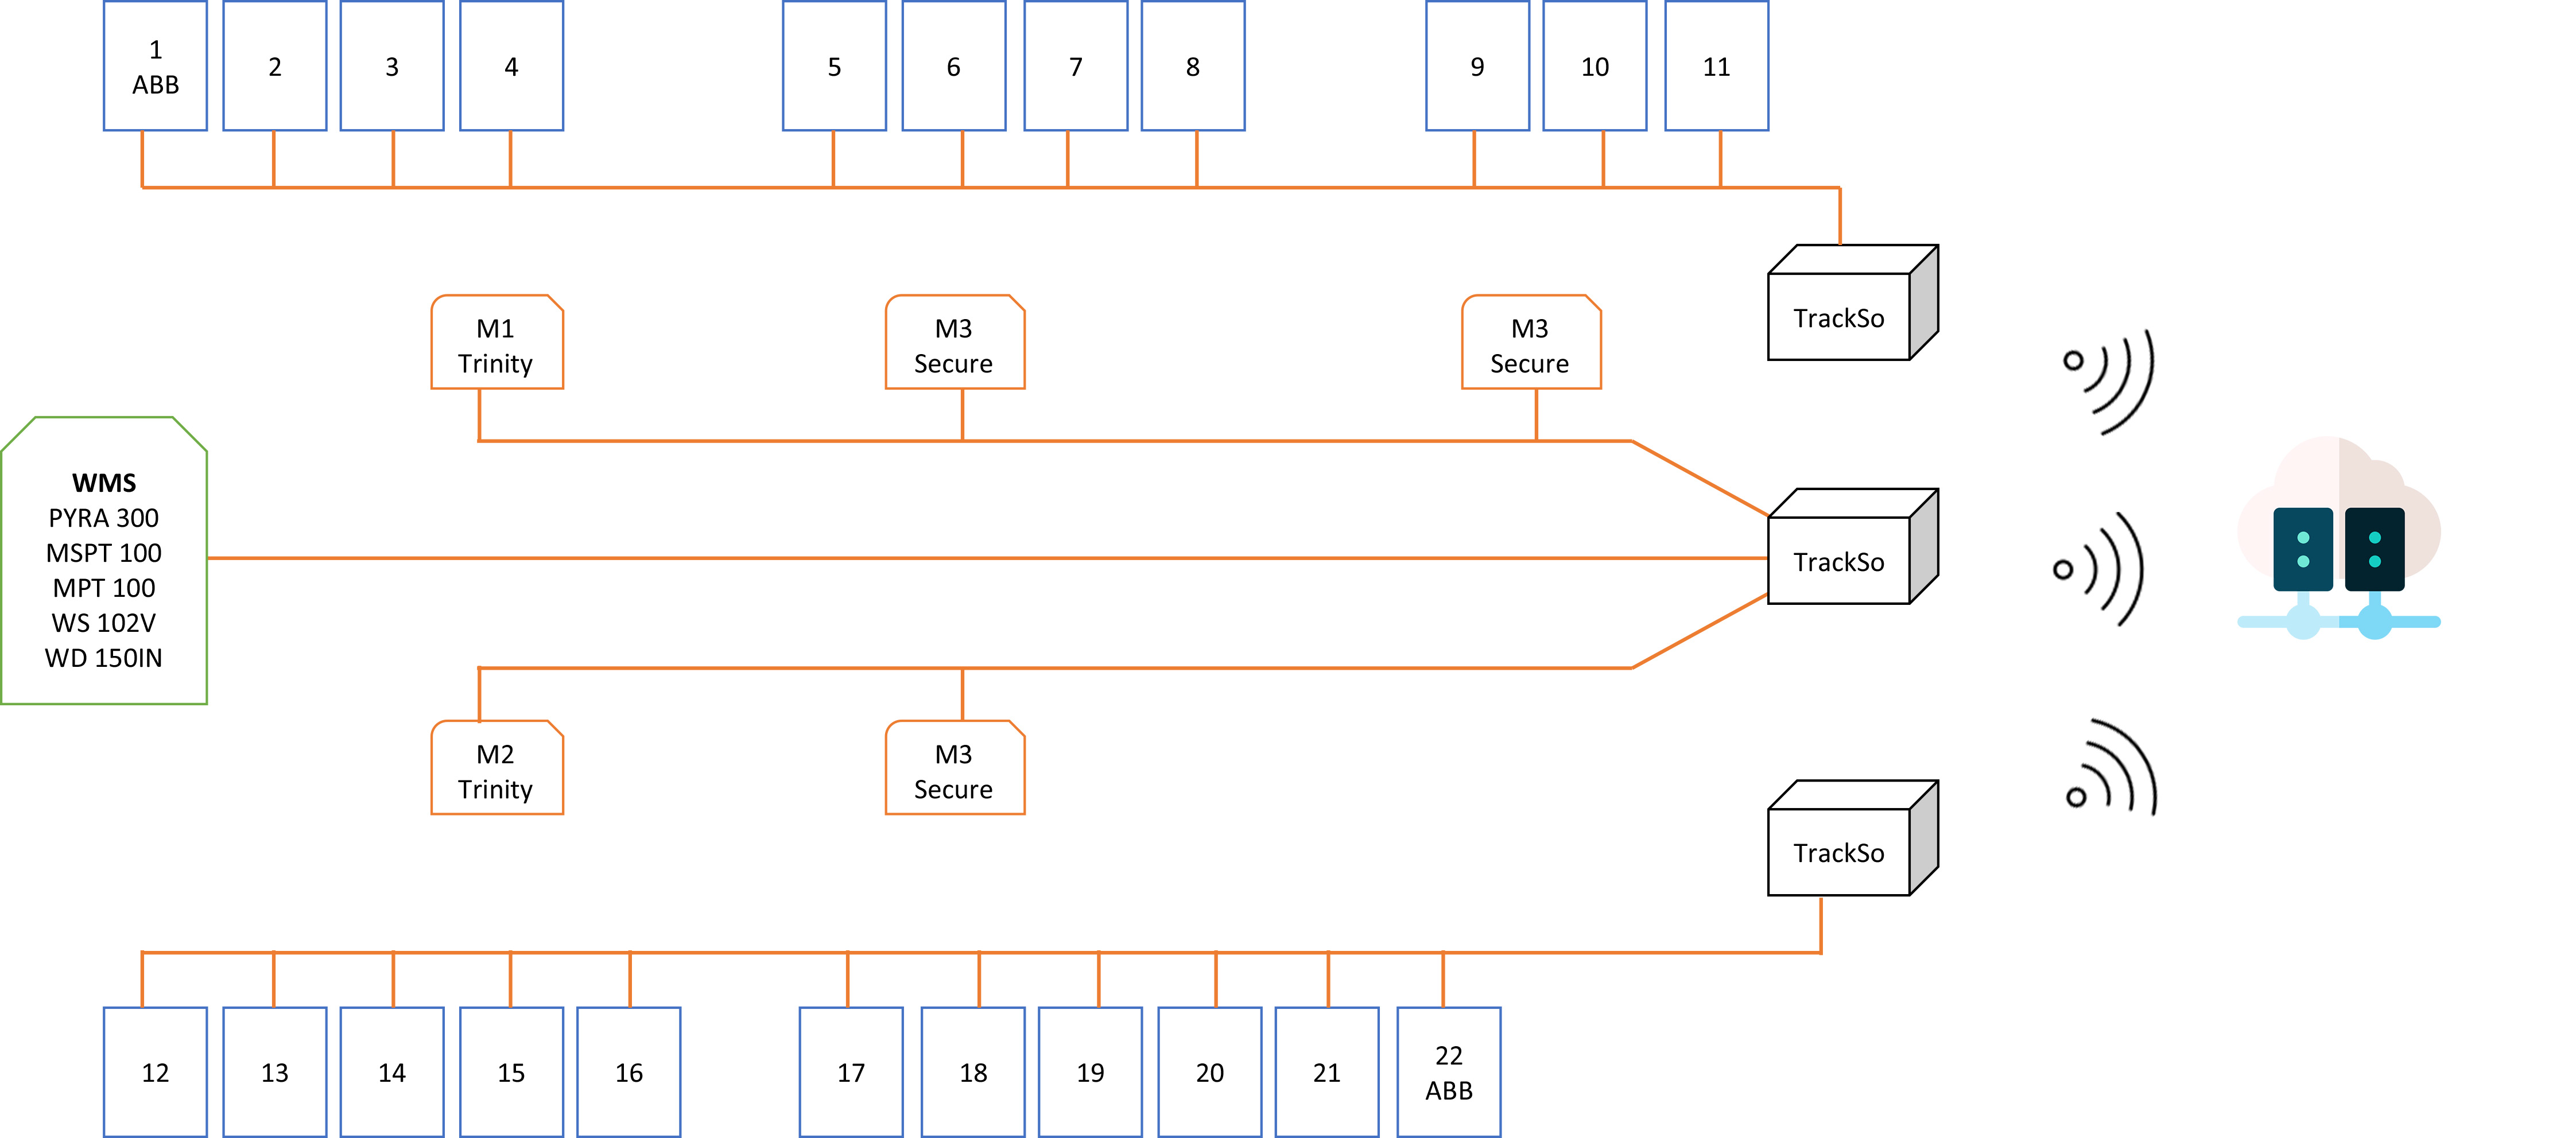
One of the major solar EPC company in north India wanted to track multiple components in their 1.2 MWp ground mounted solar PV system. The components includes:
- 18 inverter with capacity of 60 kWp of ABB
- 4 inverter with capacity of 30 kWp of ABB
- Weather station including 5 solar module temperature sensors, 1 ambient temperature sensor, 1 wind speed sensor, 1 wind direction sensor, 1 humidity sensor and 2 solar irradiation sensors of various brands & models
- 5 energy meters of Trinity & Secure to track energy production, consumption and transmission losses
- string monitoring boxes of Kernel Sistemi to track multiple string of solar PV panels
Monitoring solution provided by solar inverter OEM was not up to the mark to be able to connect and monitor all the above components.
The Solution
TrackSo being a brand agnostic IoT solution is able to monitor any and every component, irrespective of their type or brand. TrackSo expert team provided with a customised solution that could connect all these brands of components to their IoT gateway and send data to TrackSo Solar IoT platform using GSM/GPRS communication. Also, TrackSo expert team help the customer in understanding the solution in detail and further execute the overall project within the stipulated time frame.
Using TrackSo IoT solution, the customer was able to adhere to all the tender specifications as well as monitor each and every critical parameter of the solar plant remotely.
System Design
The Outcome
The outcome is that the customer can now do comparative analytics on all the components of his solar PV system

By comparing solar irradiation with inverter power output, the customer can analyse if the solar PV system is working on its optimum performance. The same can also be analysed for each inverter to understand if any of the inverters are causing poor performance.

With this chart, the customer wants to monitor the temperature variation of each inverter installed in the solar plant. By analysing the temperature variations, it is possible to infer the performance and possibilities of a potential failure in near future.
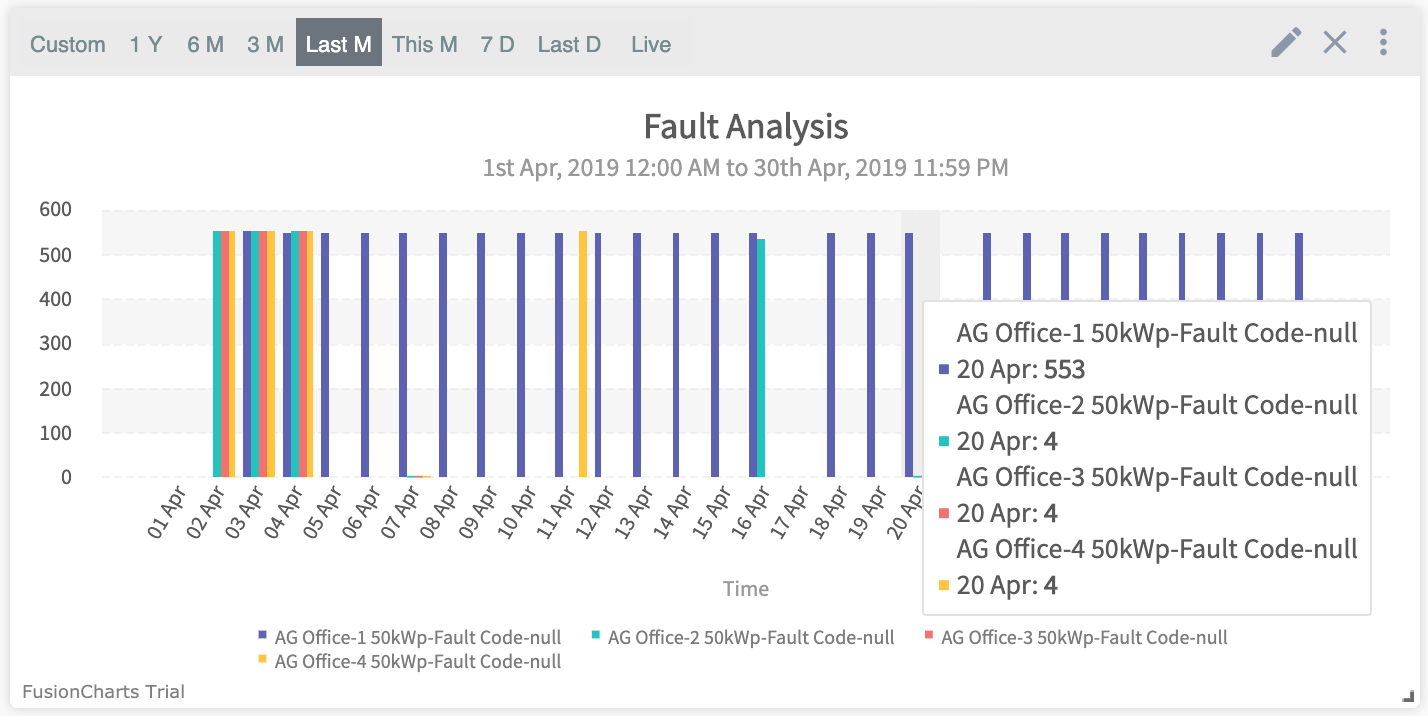
With the Fault Analysis chart, the customer can analyse the faults that occurs on each inverter LIVE or on daily basis. This helps him take proactive actions and minimise energy production losses faster. Overall, this detailed analyses also helps improve the life of the assets i.e. inverter in this case.

Here, the customer analyse how much energy was lost during transmission from the solar PV plant to the load or the grid. The Trinity energy meter was installed at the load/grid side and the power transfer was compared by the power produced.

The above doughnut cart helps customer understand the percentage of energy produced by each inverter. This is helpful to compare the production inverterwise and further understand if any of the inverters is performing lower than the others.
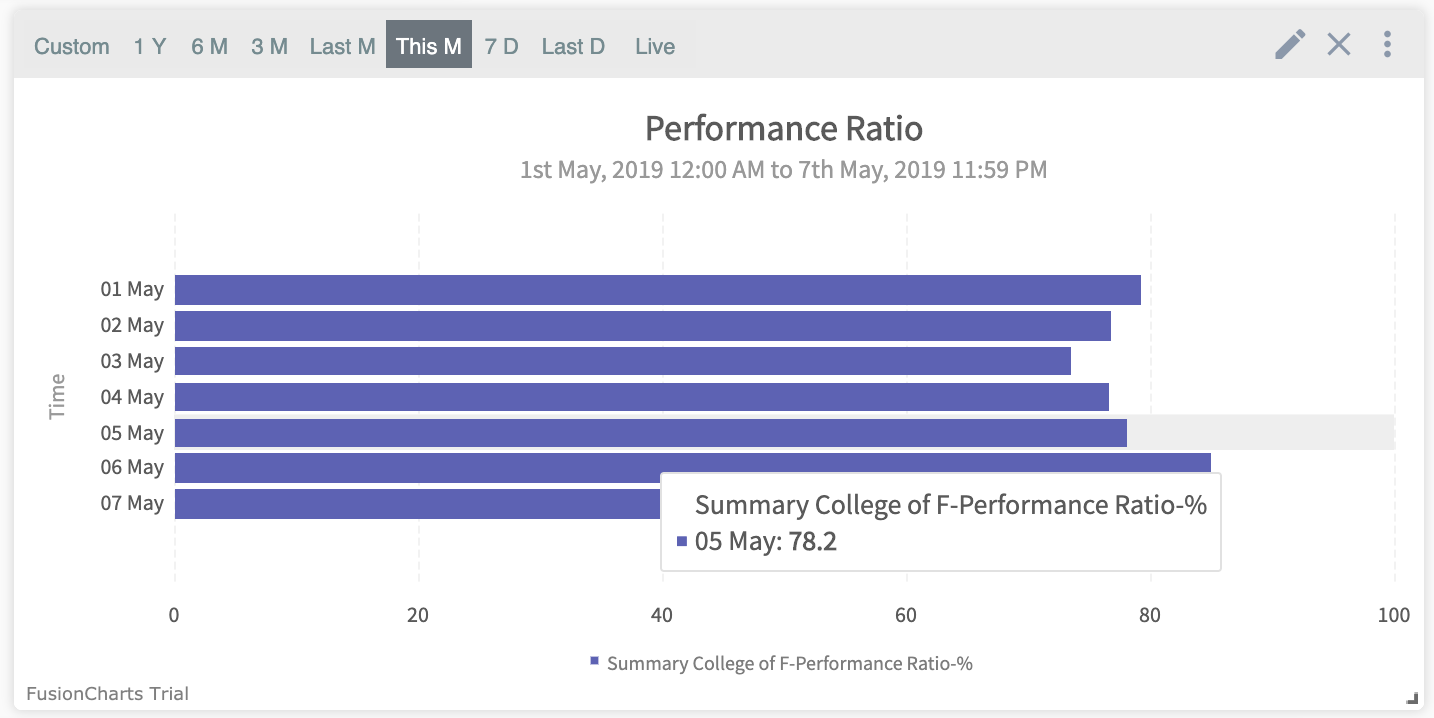
Customer could analyse the overall performance of the solar PV plant on day on day and month on month basis. With this, he/she is able to understand if the plant is working in the optimum range or not and further, what are the effects of weather on the plant’s performance.