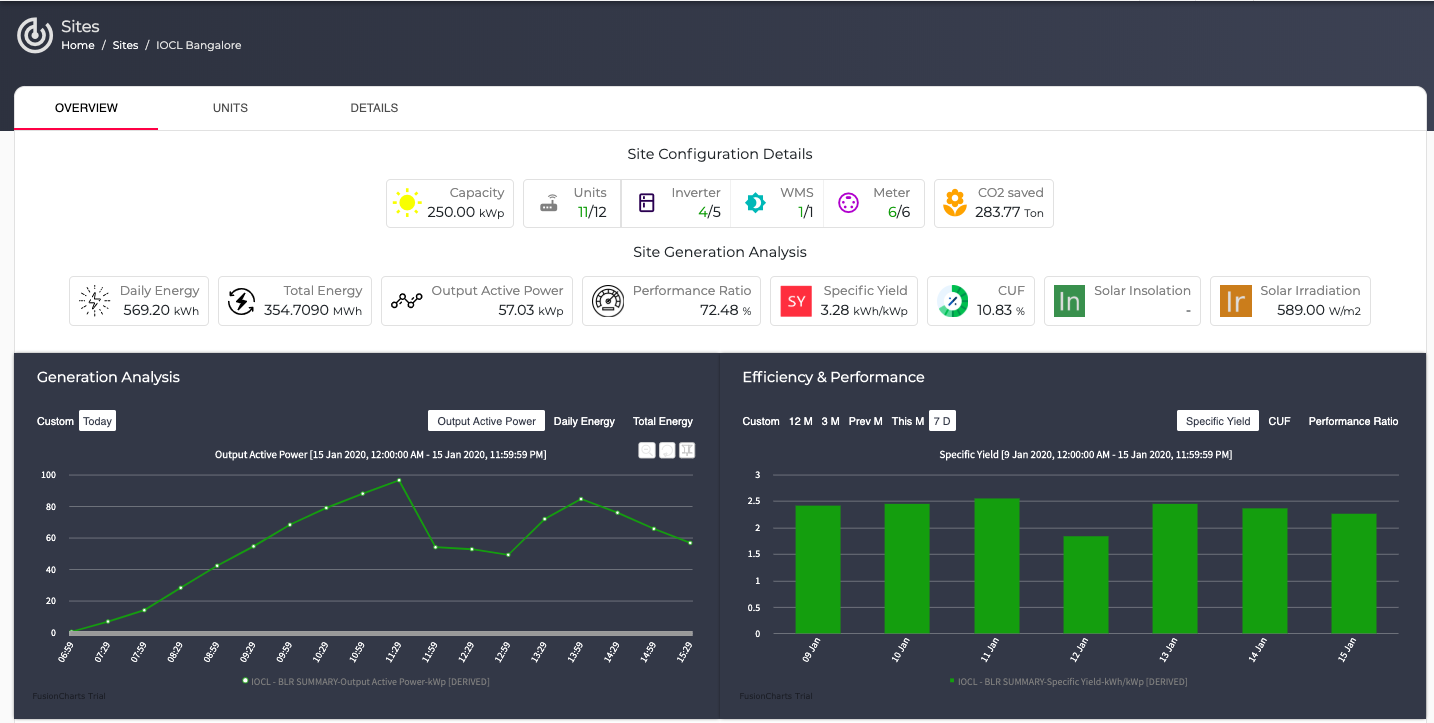
Site Configuration Detail
- Capacity – Overall DC Capapcity of the plant.
- Units – Total Number of units present. (Units Live/ Total Units Present)
- Meter – Number of meters present on the site.
- Inverter – Number of Inverters present on the site.
- WMS – Number of Weather Sensors present on the site.

Site Generation Analysis
- Daily Energy – Energy of the plant for the current day.
- Total Energy – Lifetime energy of the plant.
- Output Active Power – Instantaneous power of the plant.
- Specific Yield for the Day- Energy generated per kWp installed.
- CUF for the Day : Capacity utilisation factor is the actual output from a solar plant to the maximum possible output from it under ideal conditions.
- Solar Insolation – Amount of solar radiation over the size of a surface area over time
- Performance Ratio– is stated as percent and describes the relationship between the actual and theoretical energy outputs of the PV plant.
- Solar Irradiation – Solar Irradiation of the site.
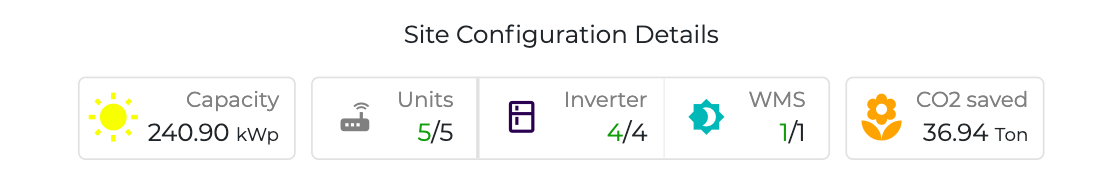
Generation Analysis
This section shows the cumulative Power and Energy generation of all the inverters present on the site.
Know more about buttons on the graph :
- Custom/Today– User can toggle between different time ranges using these buttons.
- Output Active Power: Display’s Time vs Output Power Graph.
- Daily Energy – Display’s Time vs Daily Energy graph.
- Total Energy – Display’s Time vs Total Energy graph.
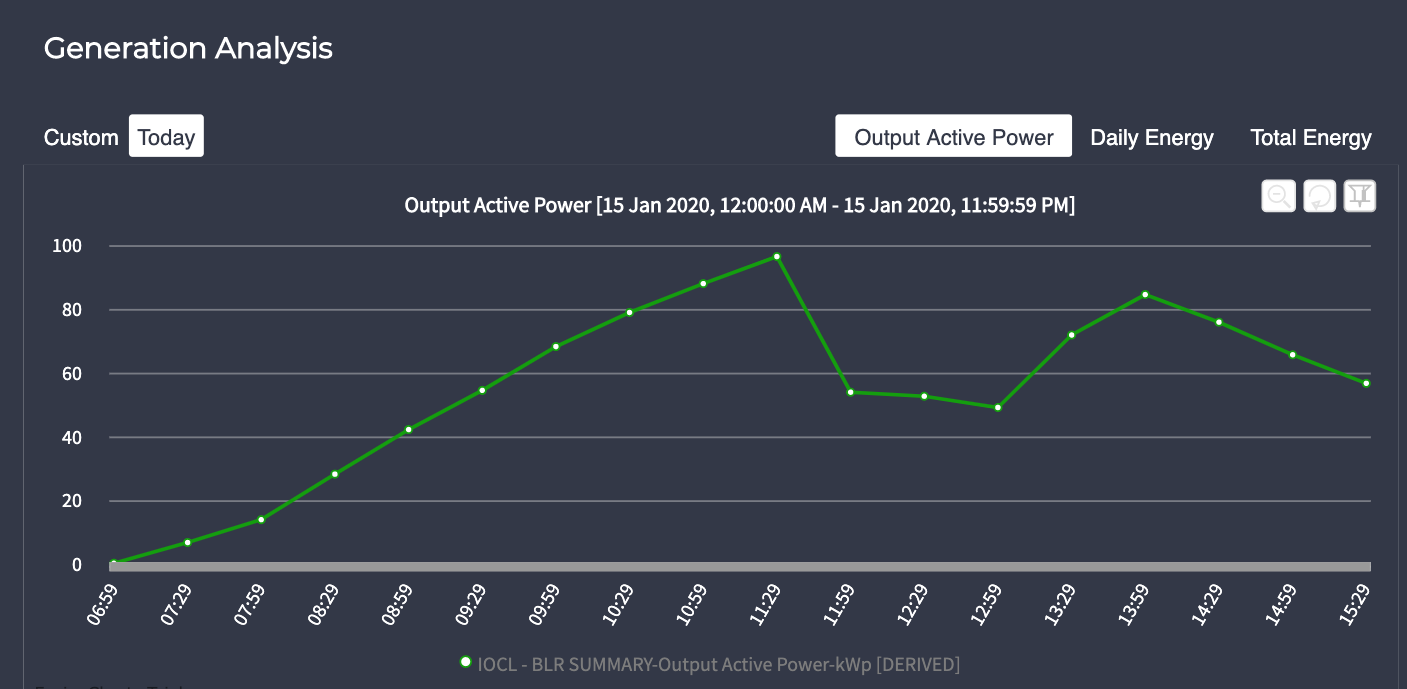
Efficiency and Performance
This section shows the overall performance of the site through three important parameters.
Know more about buttons on the graph :
- Custom/12M/3M/Prev M/This M/ 7D– User can toggle between different time ranges using these buttons.
- Specific Yield: Display’s Days vs Specific Yield Graph.
- CUF – Display’s Days vs CUF graph.
- Performance Ratio – Display’s Days vs Performance graph.
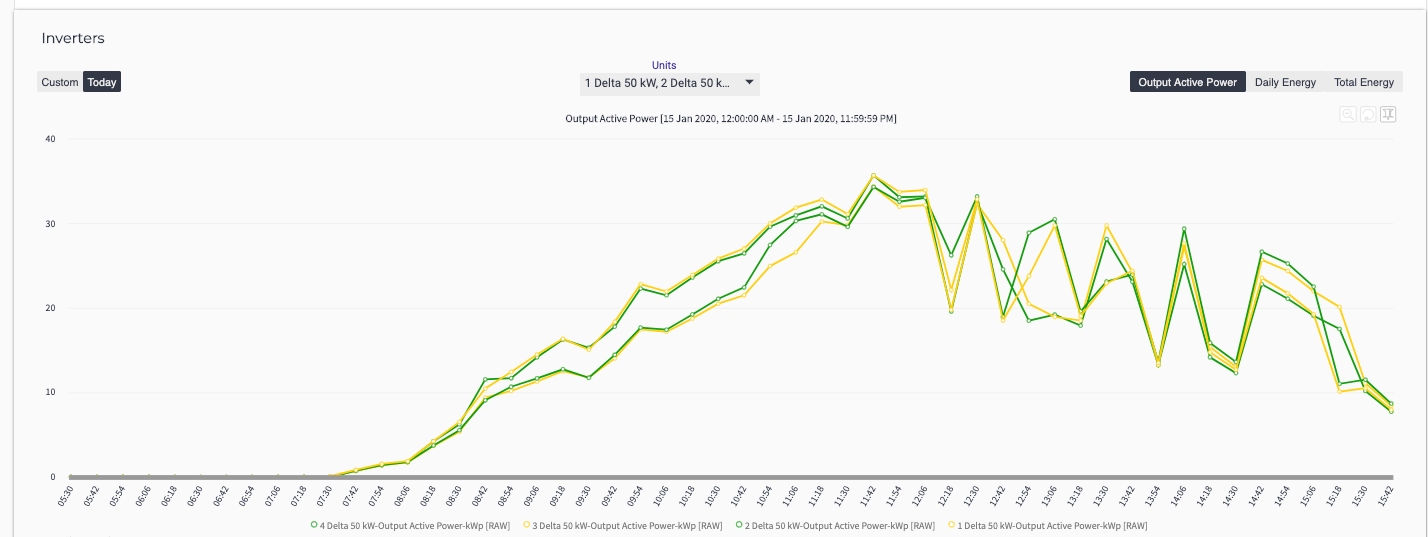
Inverters
This section shows the compartive performance of all theinverters present on the site.
Know more about buttons on the graph :
- Custom/Today– User can toggle between different time ranges using these buttons.
- Units: User can make selection of inverters through this drop down menu.
- Output Active Power: Display’s Time vs Output Power graph of inverter/s.
- Daily Energy – Display’s Time vs Daily Energy graph of inverter/s.
- Total Energy – Display’s Time vs Total Energy graph of inverter/s.
Note : The dotted lines in the graph shows the time period where the data wasn’t recieved.
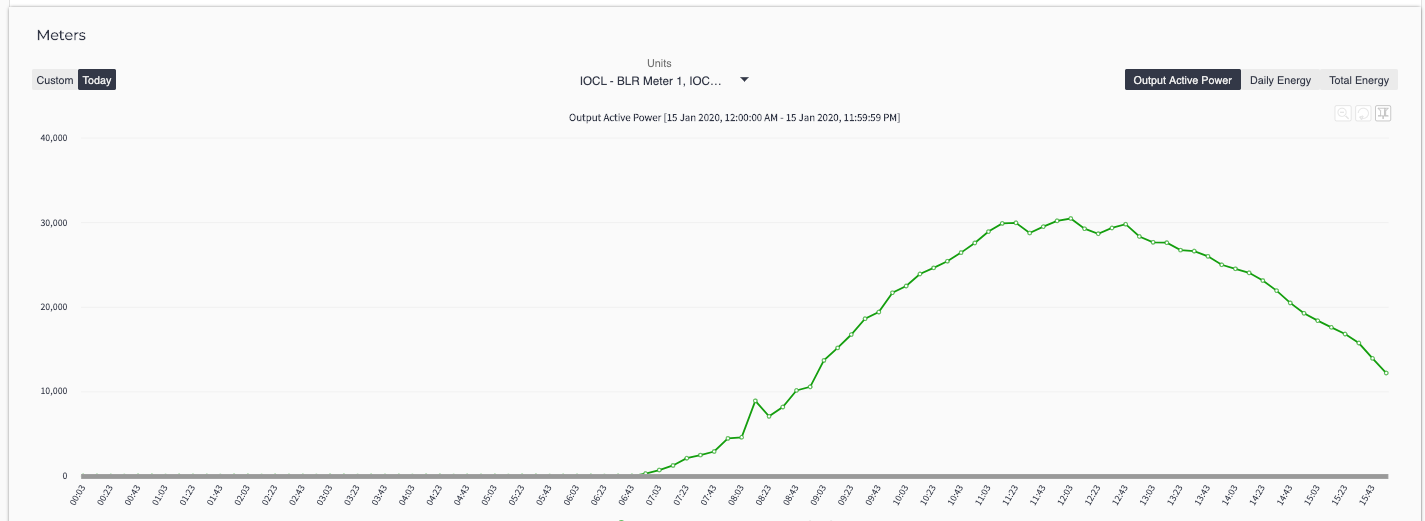
Meters
This section shows the comparative performance of all the Meters present on the site.
Know more about buttons on the graph :
- Custom/Today– User can toggle between different time ranges using these buttons.
- Units: User can make selection of meters through this drop down menu.
- Output Active Power: Display’s Time vs Output Power graph of inverter/s.
- Daily Energy – Display’s Time vs Daily Energy graph of inverter/s.
- Total Energy – Display’s Time vs Total Energy graph of inverter/s.
WMS
This section shows the comparative performance of all the weather monitoring stations present on the site.
Know more about buttons on the graph :
- Custom/Today– User can toggle between different time ranges using these buttons.
- Units: User can make selection of WMS through this drop down menu.
- Sensor Selection : User can select the desired sensors to view the data from the different sensor buttons such Solar Irraditation, Module Temperature, Ambient Temperature, Wind Speed, Wind Direction, Rain Guage, Relative Humididty.