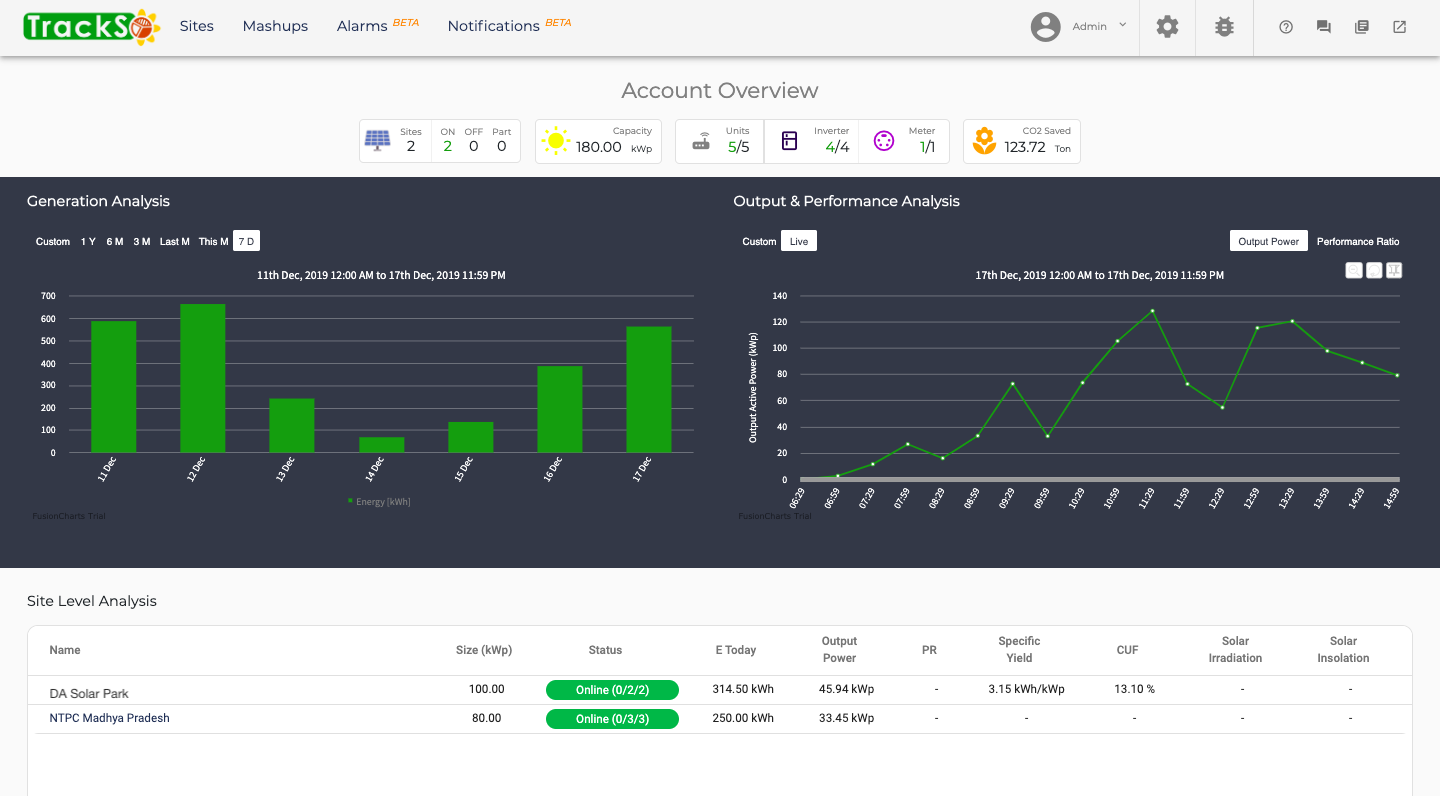
The first screen gives the overall layout of the users account. User can access their respective sites, cumulative energy of all the sites, site level faults and a lot more account level information.
 Admin Details: This section consists of the user details and the child ID’s of the user.
 Configuration : This section consists information of all the Units, Roles, Derived Parameters and API Key associated with the user account.
 Ingestion Logs : This section is the debugging section of the platform. It is extensively used by the Trackso and user to view the data packets and interpret the same.
 Raise Support Ticket: In case of any query or issue, user can reach out to Trackso support team and get their query answered within 24 hours.
 FAQ’s : Trackso users can view the commonly asked questions related to Trackso platform.
 Documentation: Quick link to reach the documentation section of the Trackso platform.
 Schedule Demo: Users can reach out to Trackso Support team to book a demo slot for platform acquaintance.
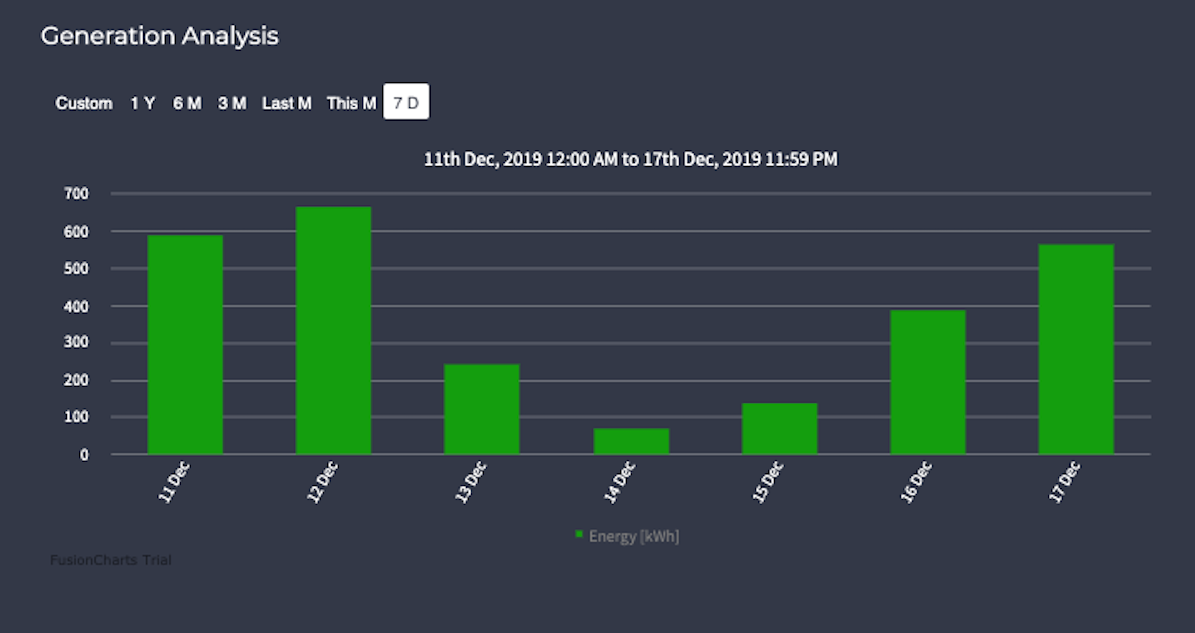
Generation Analysis : This section shows the cumulative Generation of all the sites of the Trackso Customers present on the Trackso platform. User can move across different Time ranges (7D – 7 days, 1 Month , 6 Month etc.) to view the data accordingly.
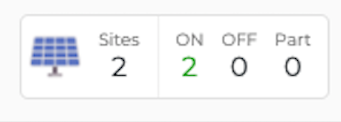
Account Meta Data : This section gives a quick overview of the account.
Sites : Total number of sites present in the account.
- ON : Total number of sites that are currently in Online state (all units are live).
- OFF : Total number of sites that currently in Offline state (all units are off).
- Part : Total number of sites that are currently in Partial On state. (Out of all units, few are live)
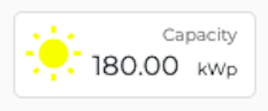
Capacity : Total DC Capacity of the plant.
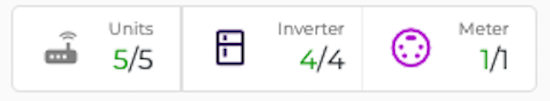
Units : Total number of units that are online out of all present states. The number of units of each type:
- Inverters
- Meters
- Sensors
- WMS (Weather Monitoring Station)
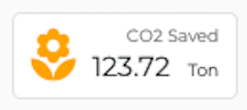
CO2 Saved: Total CO2 saved by all the sites present in the current account.
Co2 Saved in Tons= Energy Generated in MWh * 0.8
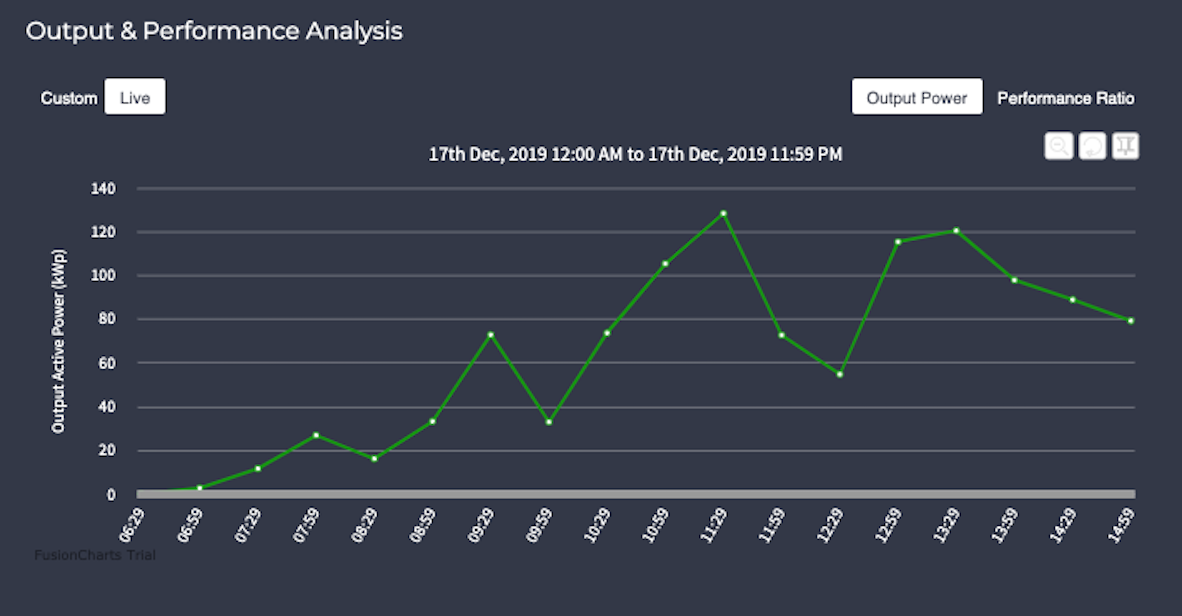
Output Active Power : This section gives a fair picture of the cumulative Output Active Power of all the sites of the Trackso customer present on the Trackso platform.
Performance Ratio : By Clicking on the ‘Performance Ratio‘, tab, Trackso customers can check view the running PR of the site.
Site Level Analysis : This section lists all the sites of customers present on the Trackso platform along with the analysed/aggregated data of the sites such as :
- Total Energy (E.Today) : The Energy generated by the site, right from the initiation of the plant.
- Current Output Active Power : The instantaneous output power of the plant.
- PR (Instantaneous): The instantaneous PR of the site, calculated by aggregating data over the every half hour interval.
- CUF:
- Specific Yield:
- Solar Irradation: Measure of total irradiation experienced by the site.
- Solar Insolation(calculated at the end of the day).
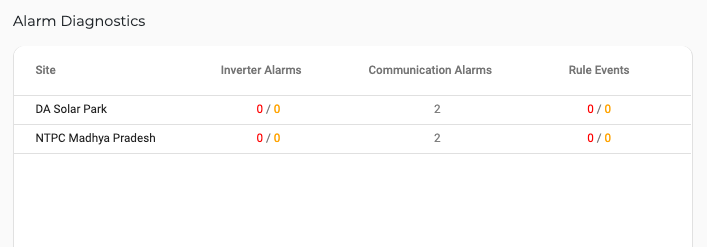
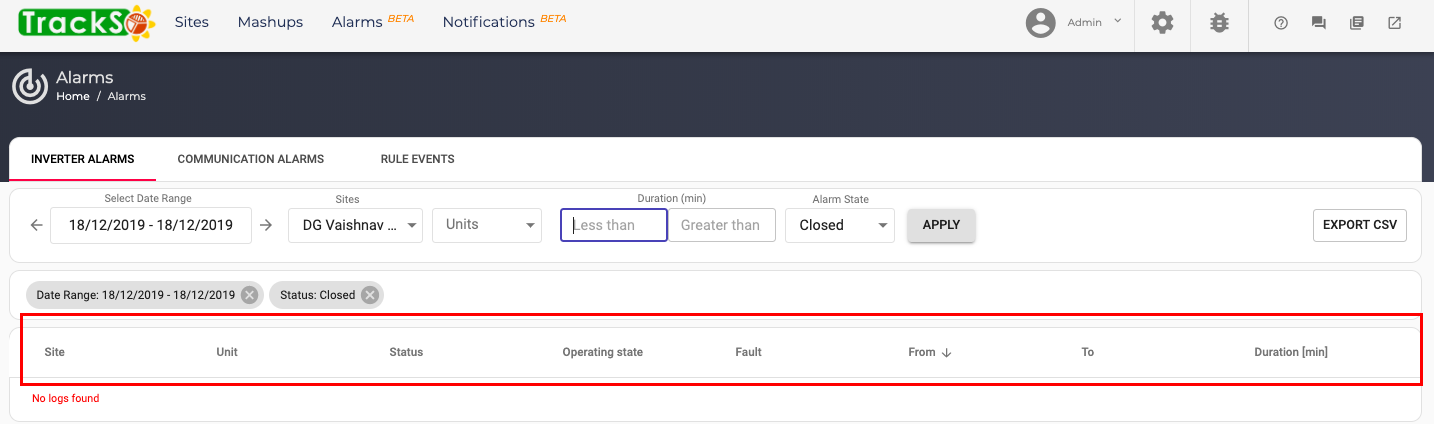
Alarm Diagnostics: Site Level Info of all the alarms(Inverter Alarms, Communication Alarms and Rule Events) to give a quick glance of the alarm state of all the sites.
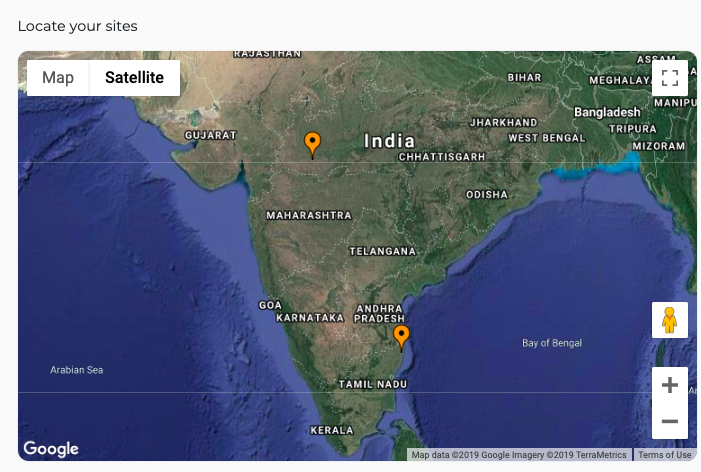
Map : The section displays the exact geo tag of all the sites Trackso customer present on the Trackso platform.