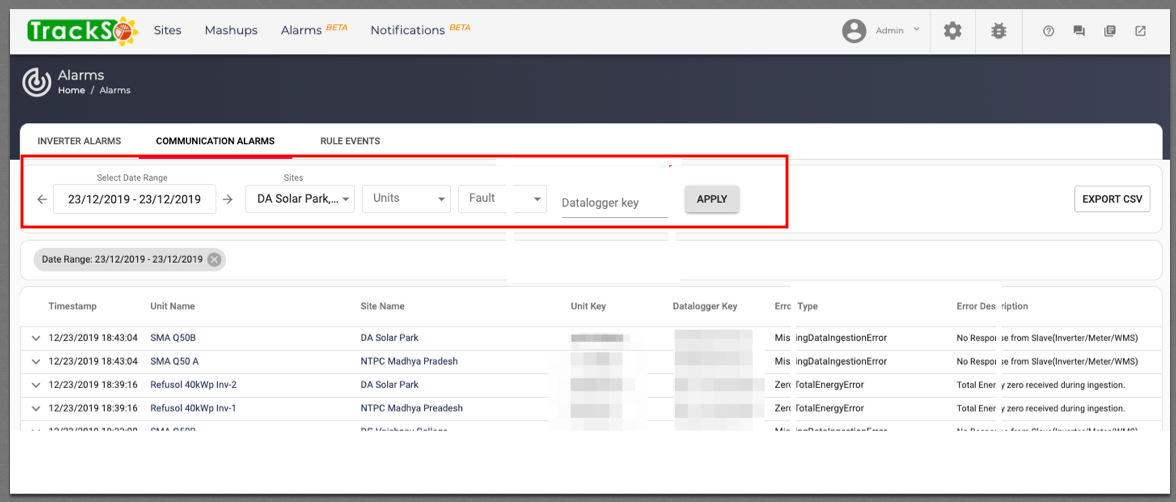
Filters : The filters allows users to filter out the alarms on the basis of :
- Date time Selection : User can filter the dates out to scroll through the historic data.
- Site Selection : User can make a selection of the sites for which they need to see the data.
- Units : User can make selection of units through this filtering criteria.
- Alarm status: User can make the selection of the ongoing alarms (open) or the ones that have occured and are catered (closed) alarms.
- Faults: These are the type of alarms that are generated when the communication between the logger and platform is hampered. The errors with their meaning are as follows:
- Ingestion Error-When platform is not able to detect any specific type of error.
- Invalid JSON ingestion Error-Data packet received from the logger is in incorrect json format & not accepted by the platform.
- No Events ingestion Error-Empty data packet is received from logger.
- Invalid Unit Key Error-Unit key available in data packet doesn’t belong to the site assigned to the logger.
- Missing Unit Key Ingestion Error-No unit key is present in the data packet received from the logger which is assigned to a specific site.
- Missing Data Ingestion Error-Specific to the condition when Slave (INV/WMS/Meter etc.) doesn’t respond on Modbus communication and no data is received for a specific unit.
- Zero Data Ingestion Error-specific to the condition when Slave (INV/WMS/Meter etc.) doesn’t respond on Modbus communication and all data points are reported as 0.
- Half/Hourly Ingestion Error-When the half hourly aggregation process fails to execute and Ingest data in Summary/derived unit.
- Daily Ingestion Error-When the daily aggregation process fails to execute and Ingest data in Summary/derived Unit.
- Derived Expression Evaluation Ingestion Error-When derived expression of any unit parameters fails to execute.
- Missing Parameter Ingestion Error-When all or few specific parameter does not exist in unit.
- Zero Total Energy Error-When inverter reports incorrect data (i.e-Total Energy =0 ) . Inverter brand specific issue.
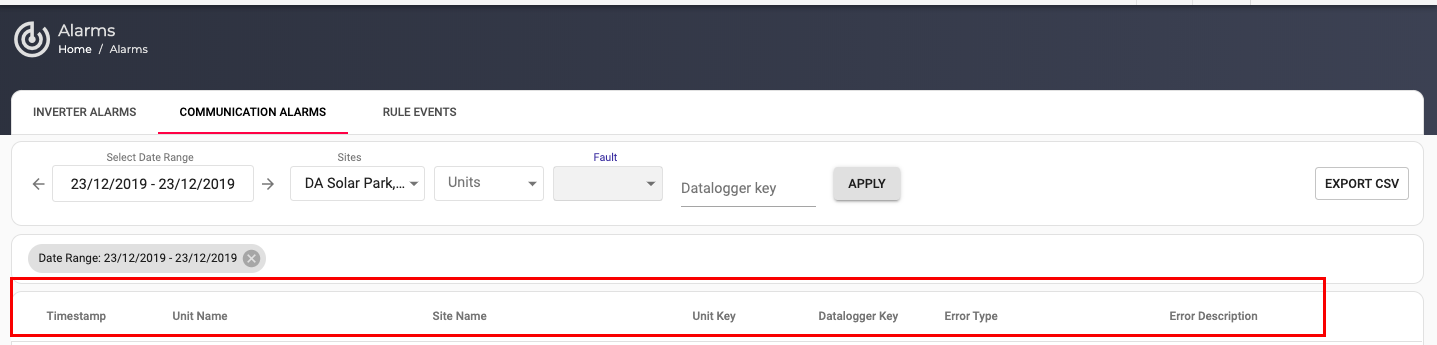
The logs of the inverter alarms are shown in a tabular manner, with an easy to interpret view :
- Timestamp : This column shows the timestamp of the fault.
- Unit Name: The unit at which this alarm is occuring/occured.
- Site Name : Name of the site where the alarm is occuring/occured.
- Unit Key : The unique identifier of the unit at which this alarm has occured.
- Datalogger Key : Unique identifier MAC/IMEI of the logger to which this unit is associated .
- Error Type: Please refer the error description above.
- Error Description : An interpretable description of the fault occured.